Application of Industrial Panel PC in Smart Transportation: A Visual Revolution in Real-Time Traffic and Bus Information
In the construction of smart transportation systems, the disconnect between data collection and information display has consistently been a core challenge restricting system efficiency. Traditional traffic guidance screens rely on fixed schedules for updates and cannot reflect real-time traffic changes; bus information dissemination systems lack dynamic adjustment capabilities, resulting in prediction error rates for passenger waiting times exceeding 30%. Through a complete chain of "data collection-intelligent processing-dynamic display," industrial panel PC are reshaping the paradigm of traffic information dissemination, providing urban managers with precise decision-making tools and creating transparent service experiences for travelers.
Industrial panel PC, through their built-in WukongEdge edge computing platform, can simultaneously access over 20 types of data sources, including traffic cameras, radar detectors, geomagnetic sensors, and GPS-equipped floating cars. Taking the Los Angeles ATSAC system as a reference, the system employs a spatiotemporal data alignment algorithm to unify low-frequency camera data (1 frame/second) and high-frequency radar data (10 times/second) onto a millisecond-level timeline, ensuring spatiotemporal consistency in traffic analysis. In a pilot project in Shenzhen, this technology increased congestion identification accuracy from 78% to 92% and reduced response time to within 15 seconds.
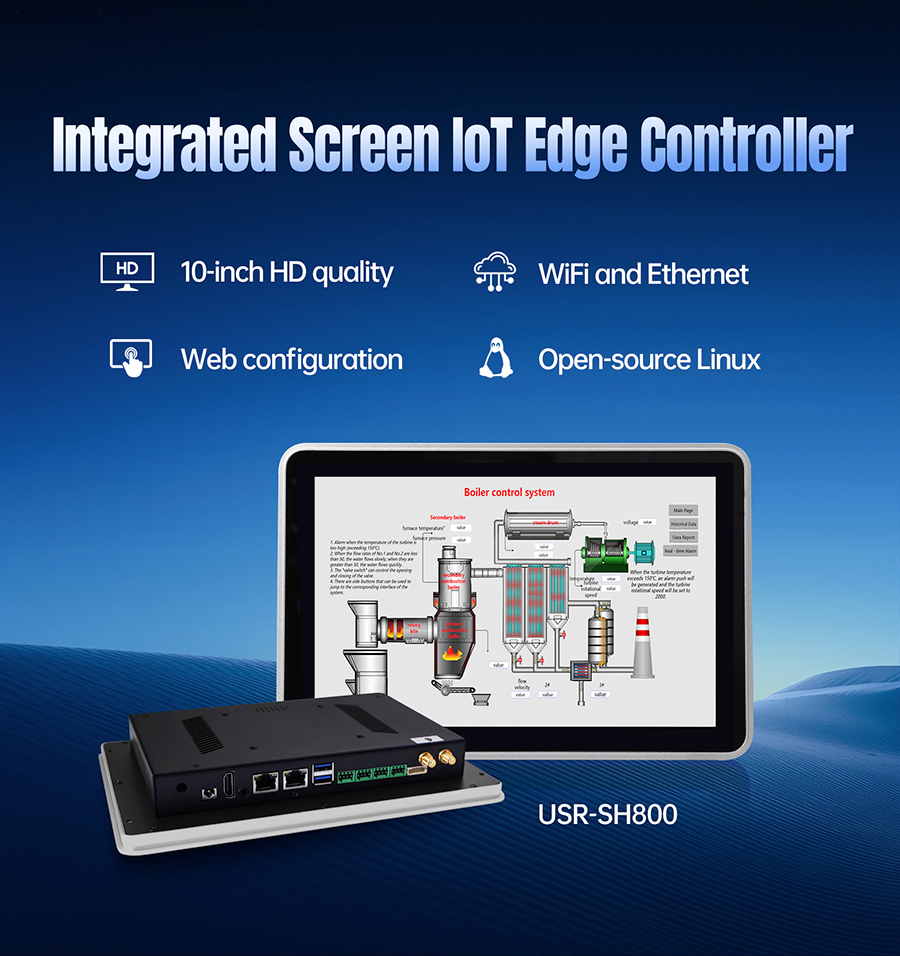
Faced with complex traffic information, the USR-SH800 industrial panel PC adopts a three-tier information architecture:
Strategic Level: Displays regional congestion indices through heat maps from 10 meters away, with red indicating severe congestion and green representing smooth traffic.
Tactical Level: Shows real-time traffic density and average speed at key intersections from 3 meters away, with data refreshing every 5 seconds.
Operational Level: Provides detailed information such as accident locations and estimated recovery times from 1 meter away, supporting touch interaction for inquiries.
This design enabled the traffic command center to increase traffic information dissemination efficiency by 40% and reduce audience travel planning time by 25% during the 2024 Hangzhou Asian Games.
By integrating an LSTM neural network model, the system can predict traffic changes for the next 15-30 minutes based on historical data. In the Chengdu Second Ring Elevated Road reconstruction project, this feature enabled traffic guidance screens to display detour suggestions for construction sections 10 minutes in advance, diverting an average of 12,000 vehicles per day and reducing the regional congestion index by 18% during construction.
The USR-SH800 establishes real-time connections with bus-mounted GPS devices via 4G/5G modules and employs a Kalman filter algorithm to smooth positioning data. Combining historical operational data with real-time traffic conditions, the system can dynamically calculate vehicle arrival times:
Off-peak hours: Error controlled within ±30 seconds.
Peak hours: Error corrected by congestion factors, not exceeding ±90 seconds.
In practice at the Nanjing Xinjiekou bus hub, this technology reduced passengers' perceived average waiting time by 40% and increased bus punctuality to 89%.
The system's built-in capacity optimization model can analyze passenger flow data in real-time:
Station level: Identifies peak boarding and alighting times at each station by fusing camera counts and card-swiping data.
Route level: Identifies passenger flow corridors and hot/cold areas based on OD matrix analysis.
Network level: Optimizes bus departure intervals across the entire network using genetic algorithms.
In the Guangzhou BRT system upgrade, this model improved the evenness of bus occupancy rates during peak hours by 22% and reduced operating costs by 15%.
The USR-SH800 supports innovative functions such as voice interaction and AR navigation:
Voice queries: Passengers can obtain information through natural language queries like "How long until the next 302 bus arrives?"
AR navigation: Displays bus routes and vehicle locations via augmented reality overlays on mobile phone cameras at complex hubs.
Accessibility mode: Provides voice announcements and vibration alerts for visually impaired individuals.
These innovations increased passenger satisfaction at bus stops in Shanghai's Lujiazui financial district from 72 to 89 points.
The USR-SH800 features an RK3568 quad-core processor with a 2.0GHz clock speed, paired with 4GB DDR4 memory and 32GB eMMC storage, capable of simultaneously processing over 200 video streams and 100,000 data points. In extreme environments ranging from -20°C to 60°C, the device maintains a continuous operation failure rate below 0.03% and an MTBF (Mean Time Between Failures) of 50,000 hours.
By processing data locally, the system compresses raw data by 90% before uploading to the cloud. In the Chongqing mountainous bus monitoring project, this technology reduced 4G network bandwidth usage by 75% and monthly data costs by 6,000 yuan.
The built-in Node-RED visual programming tool enables traffic engineers without programming backgrounds to complete:
Data flow configuration
Business logic construction
Interface prototype design
In the development of the Hangzhou West Lake scenic area bus scheduling system, this feature shortened the project cycle from three months to six weeks.
At the Shenzhen Traffic Command Center, six 86-inch USR-SH800s form a command screen displaying:
Heat maps of citywide road network congestion indices
Radar charts of traffic density in key areas
Predictions of incident impact ranges
Emergency vehicle dispatch path planning
This system increased traffic control decision-making efficiency by 60% and reduced secondary accident rates by 45% during the response to Typhoon Saola in 2024.
The USR-SH800 deployed at Beijing's Dongzhimen transportation hub enables:
Simultaneous display of arrival information for 20 routes
Cross-route transfer guidance
Passenger flow pressure warnings
One-click emergency information dissemination
After renovation, the hub's daily passenger flow capacity increased by 35%, and passenger complaint rates decreased by 72%.
At the Jiaxing service area on the G60 Shanghai-Kunming Expressway, the device displays:
Real-time information on available parking spaces
Charging station usage status
Surrounding traffic warnings
Service facility navigation
This application increased vehicle turnover at the service area by 28% and reduced charging waiting times for new energy vehicle owners by 50%.
Through BIM+GIS technology, a three-dimensional traffic model can be constructed on an integrated screen, enabling:
Accident simulation and deduction
Signal timing optimization verification
Traffic contingency plan simulation for large-scale events
After integrating a V2X module, the device can:
Receive status information from autonomous vehicles
Broadcast traffic light phase information
Issue road construction warnings
Combined with energy data, the device displays:
Bus route energy consumption rankings
Regional traffic carbon emission heat maps
Evaluation of green travel incentive effects
Industrial panel PC have evolved from mere information display terminals into data hubs and decision-making brains for smart transportation. The USR-SH800, with its dual genes of "robust configuration + flexible applications," is helping urban managers achieve three transformations:
Upgrading from empirical scheduling to data-driven operational models
Leaping from passive response to active intervention in management capabilities
Releasing system efficiency from information silos to ecological collaboration
Contact PUSR to obtain customized solutions tailored to your city's traffic characteristics and embark on a new era of intelligent traffic information visualization!